Six Sigma tools are useful for eliminating defects, analyzing the root causes of problems, and improving the quality of processes.
What is six sigma?
Six sigma is a measurement scale upon which improvement / performance can be gauged or overall methodology that provides standardized problem-solving tools improvement.
What is six sigma mean?
To understand sigma, basic statistic term is must. Sigma actually is standard deviation. Six sigma mean a process with 2Cpk, or say that 0.001ppm (0.001 defect / error found out of 1 million). However, six sigma implemented by Motorola which used in manufacturing is actually 1.5 sigma shifted. It means that for the six-sigma qualified process is actually 4.5 sigma in statistic, which is represent 1.5 Cpk or 3.4ppm.
Six Sigma Basic Statistical Introduction
What is process sigma about?
Process sigma is a possibility, a possibility that error/defect occur in the manufacturing process.
Necessary to achieve six sigma?
It depends on the customer requirement. The specification provided by customer directly affect the process sigma.
How many Sigma are required in the manufacturing process?
It depends on the customer requirement. Six sigma company will provide the requirement on either Cpk or PPM to the supplier.
Six Sigma Level
Below is the conversion table:
| ZI, x5 | Cpk | PPM |
| 0.00 | 0 | 600000 |
| 0.25 | 0.08 | 401294 |
| 0.50 | 0.17 | 308538 |
| 0.75 | 0.25 | 226627 |
| 1.00 | 0.33 | 158655 |
| 1.50 | 0.50 | 66807 |
| 2.00 | 0.67 | 22750 |
| 2.50 | 0.83 | 6210 |
| 3.00 | 1.00 | 1350 |
| 4.00 | 1.33 | 31.671 |
| 4.50 | 1.50 | 3.400 |
| 5.00 | 1.67 | 0.300 |
| 5.50 | 1.83 | 0.019 |
| 6.00 | 2.00 | 0.001 |
Above table is traditional six sigma conversion. However, the modern six sigma, 1.5 sigma shifted allowed. Use the Microsoft excel formula convert sigma process and the Cpk and ppm
Excel formula for ppm = (1-NORMDIST (sigma,0,1,1)) *1000000 where replace the sigma with the number of the process sigma. The result is showing traditional sigma ppm. For the modern sigma ppm, formula == (1-NORMDIST (sigma-1.5,0,1,1)) *1000000
Cpk = sigma/3
What can we expect from six sigma?
The answer is continuous improvement. Six sigma DMAIC method is to give continuously improve to the manufacturing process. Different method is providing different result. Therefore, understand the requirement or needed is important.
There are some other methods such as DMADV, DFSS, DMADD, Lean six sigma and Ford 8D other than DMAIC but six sigma majority using DMAIC (Define, measure, analyze, improve and control) on the manufacturing process improvement. Below is the simple graph to show the different result from different method if use them in the right way.
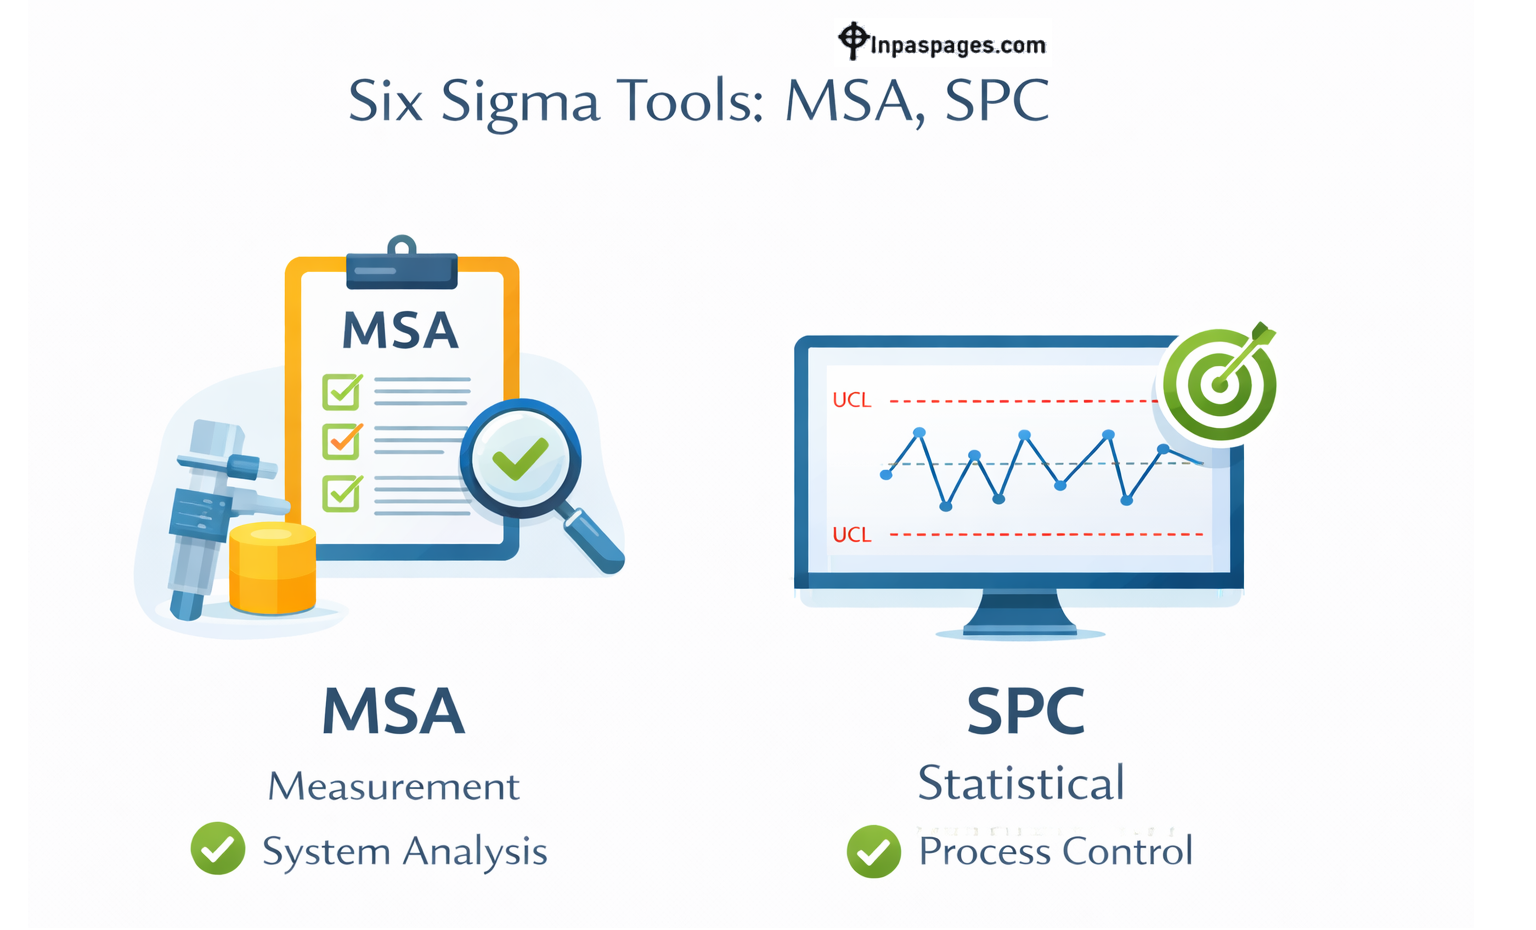
Six Sigma Tools: Measurement system analysis (MSA)
What is six sigma measurement system analysis (MSA)?
Six sigma measurement system analysis is a six sigma methodology tools. It is a process of measurement to get the characteristics value.
Why measurement system analytic (MSA) needed for the process?
- Measurement system analytic directly effect on the product and process decisions. MSA is to minimize false alarm (producer’s risk) or miss rate (customer’s risk).
- False alarm: A potential wrong decision (reject, scrap, pass, deliver) will be made based on a low-quality measurement system output.
- Miss rate: A bad part sometimes be called as “good”
What is the benefit on using measurement data?
- Process development: To determine if a significant relationship exists between two or more variables.
- Process control: The decision to adjust a manufacturing process or not is now commonly based on measurement data. Measurement data, or some statistic calculated from them, are compared with statistical control limits for the process.
- The benefit of using the measurement data is largely determined by the quality of the measurement data used.
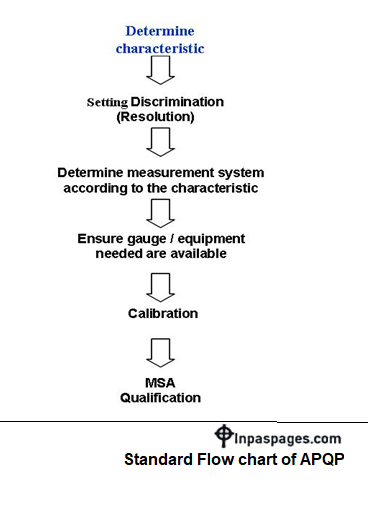
Standard flow chart for advance product quality plan (APQP)
Characteristics of Measurement System
Characteristics of six sigma measurement system including stability, discrimination (resolution), accuracy (bias), linearity and precision (variance)
Quality of measurement data
The quality of measurement data is defined by the statistical properties of multiple measurements obtained from a measurement system operating under stable conditions.
Therefore, System unstable = Not eligible to evaluate quality
The statistic properties most commonly used to characterize the quality of data are the bias and variance of the measurement system. The property called bias refers to the location of the data relative to a reference value and the property called variance refers to the spread of the data.
Total variability
Total variability contains both process variability and measurement system variability. MSA is concern on the measurement system variability.
Six Sigma Tools: Statistical Process Control (SPC)
Statistical process control (SPC) is a six-sigma process stability controller and estimator. SPC used for monitoring the process, estimate the abnormality. It gives signal once found any possibility that the abnormality going to happen. So that, the preventive action can be carried out before the problem.
Why need Statistical Process Control (SPC)?
As mentioned SPC is the tool to detect defect and estimator on the process abnormality. Use SPC to set the control level for the process, the preventive action can be carried out before the process out of the specification. This is to reduce the chances of defect happen.
How to set the control level?
The graph below showing the upper specification limit (USL) and lower specification limit (LSL)and the process sigma. Sigma six quality process shall set the control limit as per yellow line.
To set the upper control limit and lower control limit is actually depend on the process consistency.
Look at the table above, if the control limit (UCL and LCL) is one sigma, and the specification limit (USL and LSL) is three sigma, the process considers as 3 sigma process. However, if the control level is 2 sigma but the specification limit is 3 stigma, then the process sigma is actually 1.5 sigma.
The table shown that to achieve the six-sigma quality process, either improve the process consistency to tighten the control limit or ask for bigger specification limit.
How to detect abnormality
- Below occur consider as process abnormality
- – 1 point greater than 3 standard deviations from center line.
- – 9 points in now on same side of center line
- – 6 points in a row, all increasing or all decreasing
- – 14 points in a row alternating up and down
- – 2 out of 3 points greater than 2 standard deviations from center line
- – 4 out of 5 points greater than 1 standard deviation from center line
- – 15 points in a row within 1 standard deviation from center line
- – 8 points in a row greater than 1 standard deviation from center line
What mean process abnormality and what activity shall be done to prevent defect?
Process abnormality occur mean the possibility to get defect is higher than the confident interval. So, checking and confirmation on the parameter shall be done before the defect happen. Fix the error before defect occur.
Statistical process control (SPC) request data collection time to time to monitoring the process consistency. The calculation and monitoring manually take time. To overcome this problem, there is a software call Minitab can help. Minitab will analyze the result once the data was inputted.