Understanding the sources of process variation will assist in reducing the total process variation. Parallel objectives for process improvement are the reduction of costs, engineering time and manufacturing cycle time. Thus, methods for variability reduction must be efficient and cost effective.
One Objective of process improvement is to reduce the variability of key process characteristics or parameters (e.g. process outputs, responses).
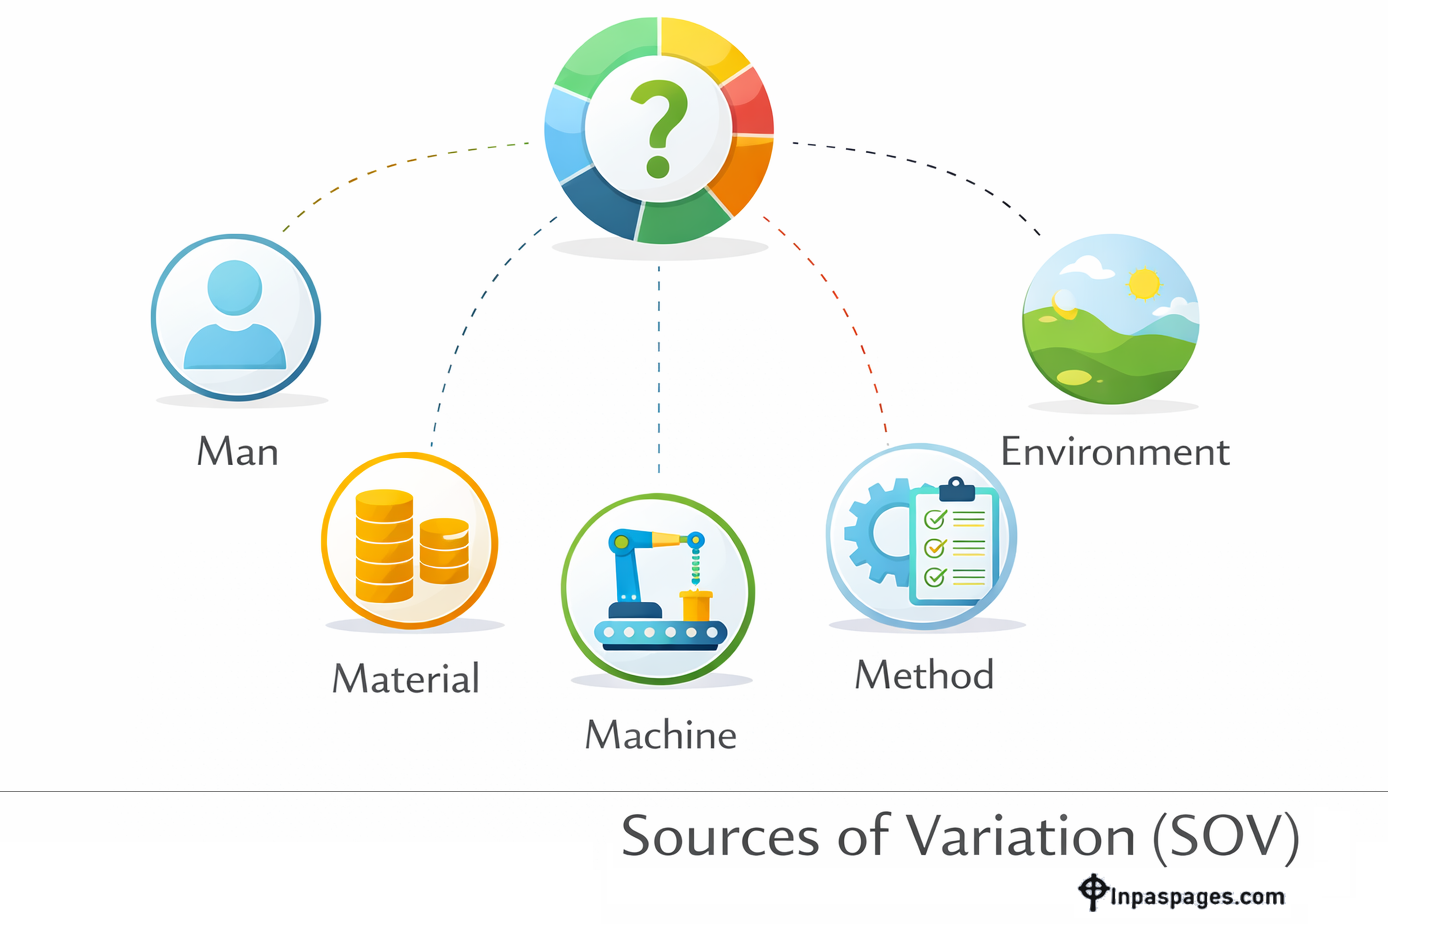
Importance of Sources of Variation (SOV) Study
A popular approach to variability reduction is to use design of experiments (DOE). To identify the factors that have the largest effect on the process. The design of an experiment is often based upon historical data (e.g. control charts). It is good engineering judgment to select a few (usually four or less) factors for analysis.
If strong evidence exists that these few factors are the source of the variability problem. Then experimentation may be the right approach. Many times, the largest source of variation is not known or is given little weight in the selection of the DOE factors.
In this case experimentation may be premature, and lead to many low information experiments and no solution to the problem.
Besides, A more efficient method for variability reduction is to first characterize the sources of variation of a process before running experiments. This is done by taking a “snapshot” of the process.
Methodology of Sources of Variation (SOV):
- The behavior of the process is observed in a production mode with no engineering adjustments (such as in a DOE) beyond normal production operation.
- Data is collected over a sufficient period of time to capture a high percentage of the historical process variation (70–80%).
- Graphical and numerical statistical methods are used to analyze the collected data and to assist in the identification of the major causes of the total variation of the process. This approach is generally called a Sources of Variation (SOV) Study.
Note that we have used variances rather than standard deviations to represent the variability of each bucket.
This is because variances are additive and standard deviations are not.
This is similar to the Pythagorean theorem. Where the square of the hypotenuse is equal to the sum of the squares of the sides of the right triangle.