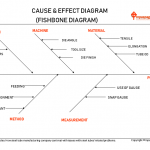
Fishbone diagram – Problem solving tools
Fishbone diagram – Problem solving tools What is Fishbone Diagram? The fishbone diagram is a technique to graphically identify and organize many possible causes of problems in structural diagram. Fishbone diagram also knows as the cause & effect diagram….

Turtle Chart or Turtle Diagram
What is turtle chart or turtle diagram & how it use as Process understand & problem solving tool Turtle chart or Turtle Diagram is map of process to get visual understanding for questioner, auditor or reader, it’s a unique technique…
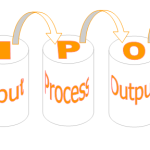
SIPOC – Supplier Input Process Output and Customer
SIPOC stand for? Supplier Input Process Output and Customer What is SIPOC Diagram? A SIPOC Diagram is a graphic representation of a high level process map covered suppliers & inputs into the process and outputs & customers of the process….