Turtle Chart or Turtle Diagram
What is turtle chart or turtle diagram & how it use as Process understand & problem solving tool
Turtle chart or Turtle Diagram is map of process to get visual understanding for questioner, auditor or reader, it’s a unique technique to prove procedure of any process to comply internal system ISO & Technical specifications with visual mapping for individual process.
Why we say turtle chart? As simple this diagram of the process or visual key or the whole procedure are constitution as like a turtle.
Turtle chart of Turtle diagram covering all aspects of whole process to conducting SIPOC method that help to customers expectations for any particular process & product that process or procedures are structured.
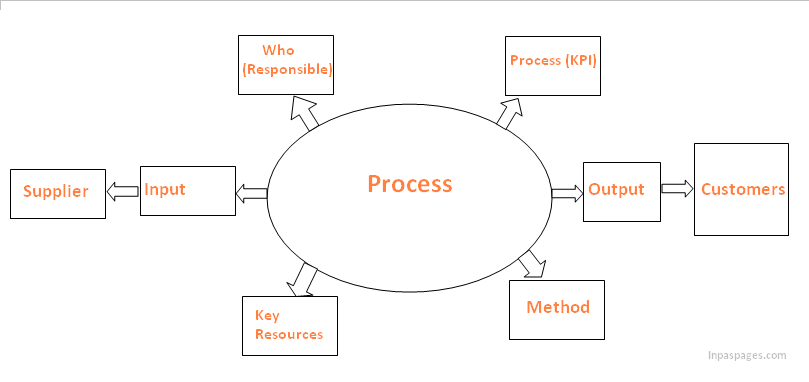
Let’s see what & how turtle diagram cover the all aspects:
- WHO: – in the turtle chart the individual process that show who is responsible for this process or owner of this process to conduct all the aspect with responsibilities excepting to make a process success.
- PROCESS KPI : – Process KPI ( Key performance indicators ) important factor for the diagram of process having a main features are enclosed to focus for the procedure of individual process, KPI ( Key Performance indicators) is objectives that are whole subjects are clustering around, its very important to keep focus to achieve the targets of KPI.
- SIPOC: – As we see in previous article what is SIPOC, but we see in this article how SIPOC help in turtle chart or turtle diagram? – SIPOC main objective is as usual to satisfaction for customer as we know, but it’s a center of the turtle chart that major part of the turtle chart or turtle diagram are focus on SIPOC, how? SIPOC is back bone of turtle chart to all factors are on depend on it, Supplier, input, process, output and customer satisfaction is full of SIPOC. Process of SIPOC need an all activities that help as input to goal customer satisfaction.
- KEY RESOURCES:- key resources that providing a subjects as input material or help to process that make a work easier or supporting to prove the process must satisfied customer is key resources is responsible is management.
- METHOD:- whole process we know how to do? key resources, SIPOC is ready, responsibilities are declared but without method nothing met any criteria of procedure, method gives meaning of all procedures how this process work to met the target customer satisfaction.
Basic of Turtle chart of Turtle Diagram visual:
Turtle chart or Turtle diagram is also help as problem solving tools that to cover PDCA method in case of understand complicated problem to simplify to trouble shooting. Plan is consider, who is responsible for identified problem, what also can define to consider as shooting of problem to cover what and which method to suitable for particular problem that easier and effectively trouble out. Suppliers, input are also covering a part of planning, D is simple as we know process part of SIPOC are help how on react on problem on process part that help to physical evidence collecting, interview of workmen and employee, checking documents to identify that problem are released or commanded, check is obviously consider as output that help to compare with result of particular problem happen, as result or output we shoot out it and make it as impact for avoiding a future trouble as bearing on process.
As simple turtle chart or turtle diagram is help to make simple to any complicated process.