Fishbone diagram – Problem solving tools
Fishbone diagram – Problem solving tools
What is Fishbone Diagram?
The fishbone diagram is a technique to graphically identify and organize many possible causes of problems in structural diagram. Fishbone diagram also knows as the cause & effect diagram.
Why use fishbone diagram?
This is the best way to identify the significant reasons of problem which is the most likely to identify root cause of a problem. It will provide directive mode to team, to understand real reasons of problems and how it was occurring. Further, fishbone helps to focus on problem solving and subjects which are impacting on decisions.
When is fishbone diagram used?
When the need exists to display and explore many possible causes of a specific problem or condition. The fishbone diagram helps to team for structural and systematical analysis cause & effect relationships. The team will able analyze many problems, major factors or factors that affecting decisions are possible to manage with graphical views.
What does it look like?
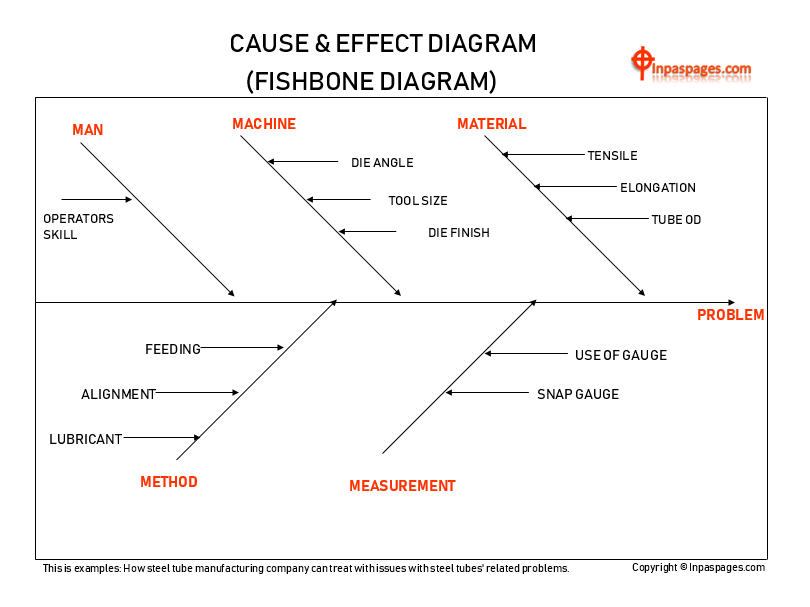
Fishbone diagram
How to make a fishbone diagram?
- Define the name of the effect in the fishbone diagram. You have to determine the specific problem to be analyzed.
- You can use the arrow for indication of processes, and draw the box around effects.
- Define the “major categories” of the causes. That can be Manpower, Materials, method, machine, environment, policies etc.
- Best way to highlight categories which are important to your situation is labeling on it.
- Analyze causes and eliminate inconsiderable or meaningless points.
- Rank causes and highlight the most likely ones for further consideration and study.
- It is to identify root causes, utilize nominal group technique.
- You can display the diagram for common area where others can add causes in it. Such as experts, affected peoples, process owners etc…
Fishbone diagram with example
In any automotive industry having a flaring problem during flaring operation. Related manager had identified “flaring is not properly done” in the fuel injector. What will be the actions on it? and how fishbone will helps in it. Let’s see as below:
- As you can see above picture, you can see above picture describe the major categories, problem is in between there.
- Investigation team will verify the processes on fishbone diagram related issue.
- Experts can verify one by one categories to ensure where real problem is?
- It is easy to identify for expert “(A) method was not right“
- But where was the issue? OK Alignment is not OK (1) Alignment issue
- Expert will deep analyze the information, why this alignment issue is occurring?
- They will interview with operators and identify “(2) unskilled operator” had performed that task
3 points as Results:
- Now, we have three things first (A ) is Category – Method was not right
- Wrong Method cause alignment issue
- Operator was not skilled or untrained hence this incident occur.
Now,
We will find what will be actions we can take on it?
| Problem | Reasons | Corrective Actions | C.A.Date |
| Flaring operation not properly done! | Flaring tool Taper Angle 30 Deg, Resulted not making proper shape | Angle of flaring tool modified as 45 Deg. Instead of 30 Deg. | 05-01-2010 |
| Operator Skill | New Operator | Educate regarding the flaring operation to the operator | Immediate |
| Tool Alignment | Not properly aligned | Proper alignment Done | 05-01-2010 |
Hope! this all information will be helpful in your regular tasks.